Orbisa Insights
Emerging Trends In Buy-Side Data
June 29, 2022
Securities lending activity in 2022 has been eventful. While meme stocks, SPACs and corporate events drove securities lending headlines in 2021, they have now been joined by global uncertainty in the form of conflict, wide-spread inflation and supply-chain shortages. The added volatility in the markets has expanded focus beyond the usual top earners in securities lending to all asset classes and regions. Using our buy-side data platform, Orbisa, we compare key differences over the first five months of 2022 and 2021 to identify a few emerging buy-side data trends that may shape the rest of the year.
HOT ETFs ACROSS THE GLOBE
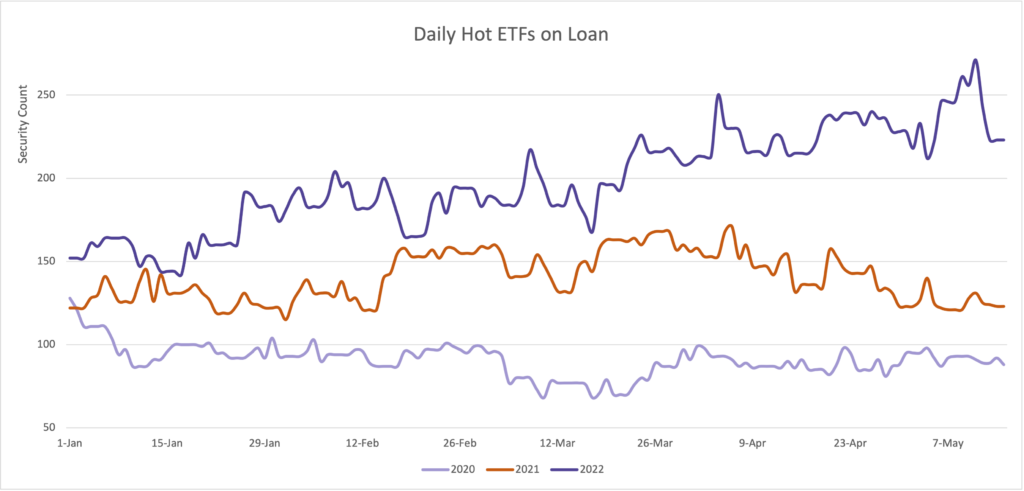
2021 and 2022 have been banner years for ETF activity, with high-yield corporate bond ETF, HYG, frequently appearing in DataLend’s monthly revenue recaps. Globally, many more ETFs have traded special (averaging over 400 bps fee) in 2022 year to date—778 in total—compared to just 582 and 403 in 2021 and 2020, respectively. The below figure shows the daily number of ETFs trading special for the last three years. As we can see, 2022 has outpaced 2020 and 2021, and the gap continued to widen in May.
CORPORATE DEBT DEMAND ON THE RISE
No other asset class has experienced as much year-over-year percentage growth in lending revenue as corporate debt. Demand has steadily been on the rise for corporate bonds over the last two years, and 2022 has seen a dramatic increase in both utilization and borrowing costs.
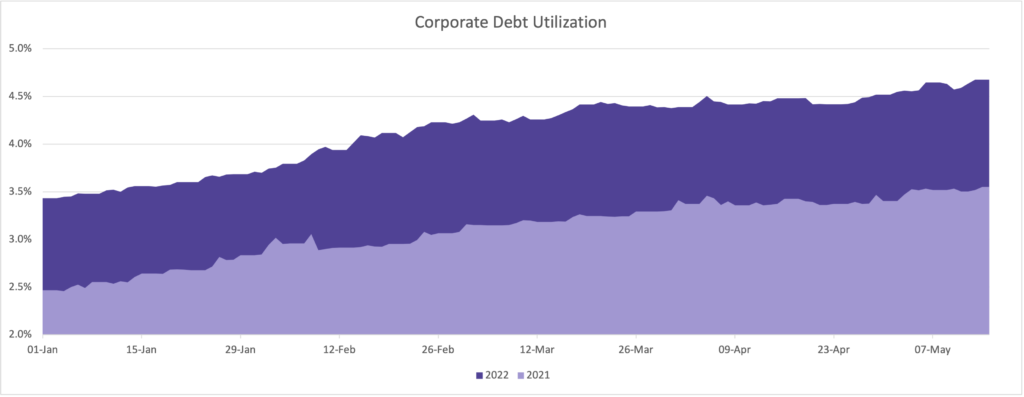
The number of bonds with a utilization greater than 50% in 2022 is 1,299, up from 674 in 2021. Similarly, the number of bonds trading at non-GC levels (fees greater than 50 bps) is up from 741 in 2021 to 1,992 in 2022. As an asset class, corporate debt utilization continues to rise. In the below figure, we can see that utilization in early 2021 ranged from 2.5% to 3.6%, while over the same period in 2022 utilization ranged from 3.4% to 4.7%.
SPECIALS COUNT UP IN ASIA PACIFIC
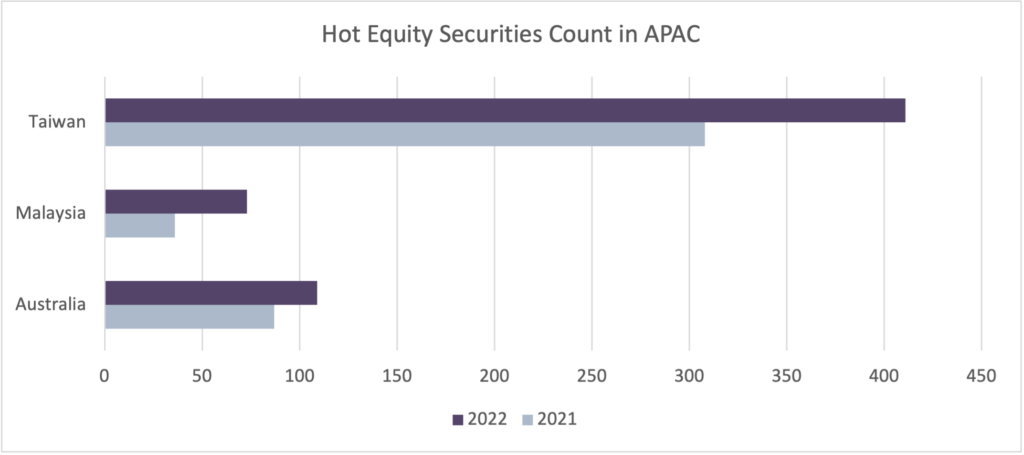
Over the past year, the number of equities that traded special (400 bps fee and above) increased by 6% globally. Several key markets in APAC significantly outpaced the average. Taiwan has 411 equities with a daily fee greater than 400 bps in 2022 compared to 302 over the same period in 2021. In Malaysia, 73 equities have traded special in 2022 compared to 36 the year prior. The Australian market also saw a noticeable increase from 87 equities in 2021 to 109 in 2022.
2022 thus far has expanded the scope of specials within the global securities lending market. As we enter the second half of the year, Orbisa will continue to track and uncover the latest trends in the industry.